File:StationaryStatesAnimation.gif

Le contento del pagina non es supportate in altere linguas.
De Wikipedia, le encyclopedia libere

StationaryStatesAnimation.gif(300 × 280 pixels, dimension del file: 223 KB, typo MIME: image/gif, repetente, 41 photogrammas)

Iste file proveni de Wikimedia Commons e pote esser usate per altere projectos. Le description de su pagina de description ibi es monstrate in basso.

Summario

Description
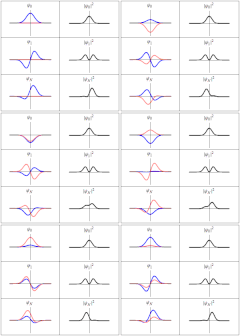
English: Three wavefunction solutions to the Time-Dependent Schrödinger equation for a harmonic oscillator. Left: The real part (blue) and imaginary part (red) of the wavefunction. Right: The probability of finding the particle at a certain position. The top two rows are the lowest two energy eigenstates, and the bottom is the superposition state , which is not an energy eigenstate. The right column illustrates why energy eigenstates are also called "stationary states".
Thus in every quantum stae,there are certain preferred positions of maximum probability
Data
Origine Obra proprie
Autor Sbyrnes321
(* Source code written in Mathematica 6.0 by Steve Byrnes, Feb. 2011. This source code is public domain. *)
(* Shows classical and quantum trajectory animations for a harmonic potential. Assume m=w=hbar=1. *)
ClearAll["Global`*"]
(*** Wavefunctions of the energy eigenstates ***)
psi[n_, x_] := (2^n*n!)^(-1/2)*Pi^(-1/4)*Exp[-x^2/2]*HermiteH[n, x];
energy[n_] := n + 1/2;
psit[n_, x_, t_] := psi[n, x] Exp[-I*energy[n]*t];
(*** A non-stationary state ***)
SeedRandom[1];
psinonstationary[x_, t_] := (psit[0, x, t]+psit[1, x, t])/Sqrt[2];

(*** Put all the plots together ***)
SetOptions[Plot, {PlotRange -> {-1, 1}, Ticks -> None, PlotStyle -> {Directive[Thick, Blue], Directive[Thick, Pink]}}];
MakeFrame[t_] := GraphicsGrid[
   {{Plot[{Re[psit[0, x, t]], Im[psit[0, x, t]]}, {x, -5, 5}, PlotLabel -> Subscript[\[Psi],0]], 
     Plot[Abs[psit[0, x, t]]^2, {x, -5, 5}, PlotStyle -> Directive[Thick, Black],
		PlotLabel -> TraditionalForm[Abs[Subscript[\[Psi],0]]^2]]},
   {Plot[{Re[psit[1, x, t]], Im[psit[1, x, t]]}, {x, -5, 5}, PlotLabel -> Subscript[\[Psi],1]], 
     Plot[Abs[psit[1, x, t]]^2, {x, -5, 5}, PlotStyle -> Directive[Thick, Black],
		PlotLabel -> TraditionalForm[Abs[Subscript[\[Psi],1]]^2]]},
   {Plot[{Re[psinonstationary[x, t]], Im[psinonstationary[x, t]]}, {x, -5, 5}, PlotLabel -> Subscript[\[Psi],N]], 
     Plot[Abs[psinonstationary[x, t]]^2, {x, -5, 5}, PlotStyle -> Directive[Thick, Black],
		PlotLabel -> TraditionalForm[Abs[Subscript[\[Psi],N]]^2]]}
   }, Frame -> All, ImageSize -> 300];
output = Table[MakeFrame[t], {t, 0, 4 Pi*40/41, 4 Pi/41}];
SetDirectory["C:\\Users\\Steve\\Desktop"]
Export["test.gif", output]

Licentia

Io, titular del derecto de autor sur iste obra, declara de publicar lo sub le sequente licentia:
Creative Commons CC-Zero Iste file es disponibile sub le Creative Commons Dedication universal al dominio public CC0 1.0.
Le persona qui associava un obra con iste documento ha dedicate le obra al dominio public per renunciar a tote su derectos sur le obra in le mundo integre sub lege de copyright, incluse tote le derectos connexe o vicin, tanto como permittite per lege. Tu pote copiar, modificar, distribuer e representar le obra, mesmo pro scopos commercial, toto sin demandar permission.

Legendas

Adde un explanation de un linea de lo que iste file representa

Objectos representate in iste file

representa

Alcun valor sin elemento Wikidata

inception anglese

20 martio 2011

Historia del file

Clicca sur un data/hora pro vider le file como appareva a ille tempore.

Data/HoraMiniaturaDimensionesUsatorCommento
actual18:21, 20 martio 2011Miniatura pro le version de 18:21, 20 martio 2011300 × 280 (223 KB)Sbyrnes321{{Information |Description ={{en|1=Three wavefunction solutions to the Time-Dependent Schrödinger equation for a harmonic oscillator. Left: The real part (blue) and imaginary part (red) of the wavefunction. Right: The probability of finding the partic

Le sequente pagina usa iste file:

Uso global de iste file

Le altere wikis sequente usa iste imagine: